3.6 Lab: Linear Regression
#load csv into dataframe
%matplotlib inline
import pandas as pd
boston_df = pd.read_csv("/Users/rcphillips/Documents/Data/Boston.csv")
#inspect data for quality
boston_df.head()
| crim | zn | indus | chas | nox | rm | age | dis | rad | tax | ptratio | black | lstat | medv | |
|---|---|---|---|---|---|---|---|---|---|---|---|---|---|---|
| 0 | 0.00632 | 18.0 | 2.31 | 0 | 0.538 | 6.575 | 65.2 | 4.0900 | 1 | 296 | 15.3 | 396.90 | 4.98 | 24.0 |
| 1 | 0.02731 | 0.0 | 7.07 | 0 | 0.469 | 6.421 | 78.9 | 4.9671 | 2 | 242 | 17.8 | 396.90 | 9.14 | 21.6 |
| 2 | 0.02729 | 0.0 | 7.07 | 0 | 0.469 | 7.185 | 61.1 | 4.9671 | 2 | 242 | 17.8 | 392.83 | 4.03 | 34.7 |
| 3 | 0.03237 | 0.0 | 2.18 | 0 | 0.458 | 6.998 | 45.8 | 6.0622 | 3 | 222 | 18.7 | 394.63 | 2.94 | 33.4 |
| 4 | 0.06905 | 0.0 | 2.18 | 0 | 0.458 | 7.147 | 54.2 | 6.0622 | 3 | 222 | 18.7 | 396.90 | 5.33 | 36.2 |
#import modelling package
from sklearn import linear_model
#predict medv using lstat
import numpy as np
lm = linear_model.LinearRegression()
#predictor value:
X=np.transpose(np.matrix(boston_df.lstat.values))
#value being estimated:
y=np.transpose(np.matrix(boston_df.medv.values))

lm.fit(X,y)
LinearRegression(copy_X=True, fit_intercept=True, n_jobs=1, normalize=False)
#gotta reshape the data  to fit it into the sklearn inputs
np.shape(boston_df.medv.values)
(506,)
np.shape(np.matrix(boston_df.medv.values))
(1, 506)
np.shape(np.transpose(np.matrix(boston_df.medv.values)))
(506, 1)
predictions=lm.predict(np.transpose(np.matrix(boston_df.lstat.values)))
side_by_side = pd.DataFrame(boston_df.medv)
side_by_side['predictions']=predictions
side_by_side['residuals']=side_by_side.medv-side_by_side.predictions
side_by_side
| medv | predictions | residuals | |
|---|---|---|---|
| 0 | 24.0 | 29.822595 | -5.822595 |
| 1 | 21.6 | 25.870390 | -4.270390 |
| 2 | 34.7 | 30.725142 | 3.974858 |
| 3 | 33.4 | 31.760696 | 1.639304 |
| 4 | 36.2 | 29.490078 | 6.709922 |
| 5 | 28.7 | 29.604084 | -0.904084 |
| 6 | 22.9 | 22.744727 | 0.155273 |
| 7 | 27.1 | 16.360396 | 10.739604 |
| 8 | 16.5 | 6.118864 | 10.381136 |
| 9 | 18.9 | 18.307997 | 0.592003 |
| 10 | 15.0 | 15.125332 | -0.125332 |
| 11 | 18.9 | 21.946686 | -3.046686 |
| 12 | 21.7 | 19.628566 | 2.071434 |
| 13 | 20.4 | 26.706433 | -6.306433 |
| 14 | 18.2 | 24.806335 | -6.606335 |
| 15 | 19.9 | 26.506923 | -6.606923 |
| 16 | 23.1 | 28.302516 | -5.202516 |
| 17 | 17.5 | 20.616617 | -3.116617 |
| 18 | 20.2 | 23.447764 | -3.247764 |
| 19 | 18.2 | 23.837284 | -5.637284 |
| 20 | 13.6 | 14.583803 | -0.983803 |
| 21 | 19.6 | 21.414658 | -1.814658 |
| 22 | 15.2 | 16.768917 | -1.568917 |
| 23 | 14.5 | 15.666860 | -1.166860 |
| 24 | 15.6 | 19.068036 | -3.468036 |
| 25 | 13.9 | 18.868526 | -4.968526 |
| 26 | 16.6 | 20.483610 | -3.883610 |
| 27 | 14.8 | 18.136988 | -3.336988 |
| 28 | 18.4 | 22.393209 | -3.993209 |
| 29 | 21.0 | 23.172250 | -2.172250 |
| ... | ... | ... | ... |
| 476 | 16.7 | 16.806919 | -0.106919 |
| 477 | 12.0 | 10.888111 | 1.111889 |
| 478 | 14.6 | 17.424451 | -2.824451 |
| 479 | 21.4 | 22.098694 | -0.698694 |
| 480 | 23.0 | 24.350311 | -1.350311 |
| 481 | 23.7 | 27.200459 | -3.500459 |
| 482 | 25.0 | 27.893995 | -2.893995 |
| 483 | 21.8 | 24.654327 | -2.854327 |
| 484 | 20.6 | 21.880183 | -1.280183 |
| 485 | 21.2 | 24.502319 | -3.302319 |
| 486 | 19.1 | 20.322102 | -1.222102 |
| 487 | 20.6 | 23.675776 | -3.075776 |
| 488 | 15.2 | 17.395950 | -2.195950 |
| 489 | 7.0 | 11.781158 | -4.781158 |
| 490 | 8.1 | 6.356376 | 1.743624 |
| 491 | 13.6 | 17.386449 | -3.786449 |
| 492 | 20.1 | 21.870682 | -1.770682 |
| 493 | 21.8 | 23.143748 | -1.343748 |
| 494 | 24.5 | 21.642670 | 2.857330 |
| 495 | 23.1 | 17.832972 | 5.267028 |
| 496 | 19.7 | 14.469798 | 5.230202 |
| 497 | 18.3 | 21.158145 | -2.858145 |
| 498 | 21.2 | 22.279203 | -1.079203 |
| 499 | 17.5 | 20.208096 | -2.708096 |
| 500 | 16.8 | 20.939634 | -4.139634 |
| 501 | 22.4 | 25.366864 | -2.966864 |
| 502 | 20.6 | 25.927393 | -5.327393 |
| 503 | 23.9 | 29.195563 | -5.295563 |
| 504 | 22.0 | 28.397521 | -6.397521 |
| 505 | 11.9 | 27.067452 | -15.167452 |
506 rows × 3 columns
#extract interesting model features.
coef=lm.coef_
print('Coefficients: \n', coef)
from scipy import stats
slope, intercept, r_value, p_value, std_err = stats.linregress(list(boston_df.lstat.values), list(boston_df.medv.values))

print('slope,            intercept,      r_value,       p_value,        std_err' )
print(slope, intercept, r_value, p_value, std_err )
Coefficients:
 [[-0.95004935]]
slope,            intercept,      r_value,       p_value,        std_err
-0.950049353758 34.5538408794 -0.737662726174 5.08110339439e-88 0.0387334162126
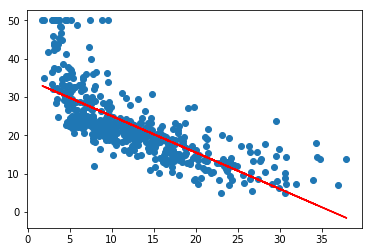
#plot data, and line of best fit
import matplotlib.pyplot as plt
lstat = list(boston_df.lstat.values)
medv= list(boston_df.medv.values)
a=plt.scatter(lstat,medv)
plt.plot(lstat,predictions, color='red')
[<matplotlib.lines.Line2D at 0x1108115c0>]
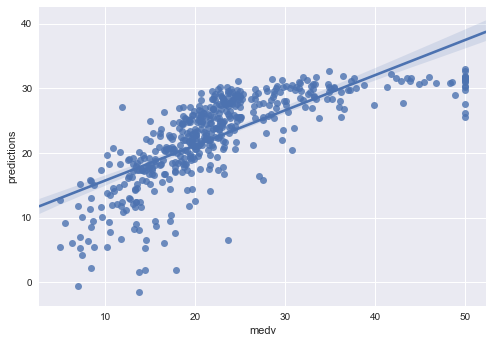
#plotting residuals
import seaborn as sns
sns.regplot(side_by_side.medv, side_by_side.predictions)
<matplotlib.axes._subplots.AxesSubplot at 0x1142f0128>
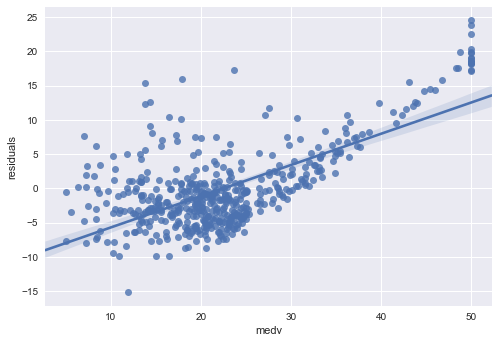
sns.regplot(side_by_side.medv, side_by_side.residuals)
<matplotlib.axes._subplots.AxesSubplot at 0x114309400>
Multiple Linear Regression
#predict medv using lstat and crim
import numpy as np
lm = linear_model.LinearRegression()
#predictor value:
X=np.transpose(np.matrix(boston_df.lstat.values))
#value being estimated:
a=np.transpose(np.matrix(boston_df.medv.values))
b=np.transpose(np.matrix(boston_df.crim.values))
y=np.append(a,b,1)

lm.fit(X,y)
LinearRegression(copy_X=True, fit_intercept=True, n_jobs=1, normalize=False)
coef=lm.coef_
import statsmodels.formula.api as smf
smf.OLS(X,y)
<statsmodels.regression.linear_model.OLS at 0x114977080>
results=smf.OLS('crim ~ crim ', boston_df).fit()
---------------------------------------------------------------------------

TypeError                                 Traceback (most recent call last)

<ipython-input-24-6996c1147a45> in <module>()
----> 1 results=smf.OLS('crim ~ crim ', boston_df).fit()


/Users/rcphillips/anaconda3/lib/python3.5/site-packages/statsmodels/regression/linear_model.py in __init__(self, endog, exog, missing, hasconst, **kwargs)
    629                  **kwargs):
    630         super(OLS, self).__init__(endog, exog, missing=missing,
--> 631                                   hasconst=hasconst, **kwargs)
    632         if "weights" in self._init_keys:
    633             self._init_keys.remove("weights")


/Users/rcphillips/anaconda3/lib/python3.5/site-packages/statsmodels/regression/linear_model.py in __init__(self, endog, exog, weights, missing, hasconst, **kwargs)
    524             weights = weights.squeeze()
    525         super(WLS, self).__init__(endog, exog, missing=missing,
--> 526                                   weights=weights, hasconst=hasconst, **kwargs)
    527         nobs = self.exog.shape[0]
    528         weights = self.weights


/Users/rcphillips/anaconda3/lib/python3.5/site-packages/statsmodels/regression/linear_model.py in __init__(self, endog, exog, **kwargs)
     93     """
     94     def __init__(self, endog, exog, **kwargs):
---> 95         super(RegressionModel, self).__init__(endog, exog, **kwargs)
     96         self._data_attr.extend(['pinv_wexog', 'wendog', 'wexog', 'weights'])
     97


/Users/rcphillips/anaconda3/lib/python3.5/site-packages/statsmodels/base/model.py in __init__(self, endog, exog, **kwargs)
    210
    211     def __init__(self, endog, exog=None, **kwargs):
--> 212         super(LikelihoodModel, self).__init__(endog, exog, **kwargs)
    213         self.initialize()
    214


/Users/rcphillips/anaconda3/lib/python3.5/site-packages/statsmodels/base/model.py in __init__(self, endog, exog, **kwargs)
     61         hasconst = kwargs.pop('hasconst', None)
     62         self.data = self._handle_data(endog, exog, missing, hasconst,
---> 63                                       **kwargs)
     64         self.k_constant = self.data.k_constant
     65         self.exog = self.data.exog


/Users/rcphillips/anaconda3/lib/python3.5/site-packages/statsmodels/base/model.py in _handle_data(self, endog, exog, missing, hasconst, **kwargs)
     86
     87     def _handle_data(self, endog, exog, missing, hasconst, **kwargs):
---> 88         data = handle_data(endog, exog, missing, hasconst, **kwargs)
     89         # kwargs arrays could have changed, easier to just attach here
     90         for key in kwargs:


/Users/rcphillips/anaconda3/lib/python3.5/site-packages/statsmodels/base/data.py in handle_data(endog, exog, missing, hasconst, **kwargs)
    628     klass = handle_data_class_factory(endog, exog)
    629     return klass(endog, exog=exog, missing=missing, hasconst=hasconst,
--> 630                  **kwargs)


/Users/rcphillips/anaconda3/lib/python3.5/site-packages/statsmodels/base/data.py in __init__(self, endog, exog, missing, hasconst, **kwargs)
     74             self.orig_endog = endog
     75             self.orig_exog = exog
---> 76             self.endog, self.exog = self._convert_endog_exog(endog, exog)
     77
     78         # this has side-effects, attaches k_constant and const_idx


/Users/rcphillips/anaconda3/lib/python3.5/site-packages/statsmodels/base/data.py in _convert_endog_exog(self, endog, exog)
    471             raise ValueError("Pandas data cast to numpy dtype of object. "
    472                              "Check input data with np.asarray(data).")
--> 473         return super(PandasData, self)._convert_endog_exog(endog, exog)
    474
    475     @classmethod


/Users/rcphillips/anaconda3/lib/python3.5/site-packages/statsmodels/base/data.py in _convert_endog_exog(self, endog, exog)
    310
    311         # for consistent outputs if endog is (n,1)
--> 312         yarr = self._get_yarr(endog)
    313         xarr = None
    314         if exog is not None:


/Users/rcphillips/anaconda3/lib/python3.5/site-packages/statsmodels/base/data.py in _get_yarr(self, endog)
    385             endog = data_util.struct_to_ndarray(endog)
    386         endog = np.asarray(endog)
--> 387         if len(endog) == 1:  # never squeeze to a scalar
    388             if endog.ndim == 1:
    389                 return endog


TypeError: len() of unsized object
boston_df.columns
Index(['crim', 'zn', 'indus', 'chas', 'nox', 'rm', 'age', 'dis', 'rad', 'tax',
       'ptratio', 'black', 'lstat', 'medv'],
      dtype='object')