Mapping
Hello!
Today I wanted to show you how quickly and neatly you could do "magic maps". With just time, latitude, and longitude, you could have moving maps in 60 minutes!
Well, it's been 3 hours, but I do have my map.
Lesson learned. Go with Kaggle if you're just trying to demonstrate the clean case.
Ready? Here we go.
(Data is from: https://www.kaggle.com/c/sf-crime)
#get data to sql
import psycopg2
from sqlalchemy import create_engine
#get the connection to sql established
engine = create_engine('postgresql+psycopg2://postgres@localhost')
import pandas as pd
import numpy as np
import folium
from folium import plugins
from folium.plugins import MarkerCluster
from io import StringIO
import folium
import geopy
#get data into sql
#df=pd.read_csv("../../data/sf_crime_kaggle/train.csv")
#df.columns = ['dates','category','descript','dayofweek','pd_district','resolution','address','latitude','longitude']
#df.to_sql('sf_crime',engine, if_exists='replace')
Pull the data down with just the space, time, and features you might be interested in.
# functional heatmap
df=pd.read_sql_query('''
SELECT longitude as latitude,
       latitude as longitude,
       extract('hour' from dates::timestamp) as hour,
       category,
       COUNT(*)
FROM sf_crime
WHERE category = 'ASSAULT'
GROUP BY 1,2,3,4
''',engine)
df.head(3)
| latitude | longitude | hour | category | count | |
|---|---|---|---|---|---|
| 0 | 37.777873 | -122.391425 | 22.0 | ASSAULT | 7 |
| 1 | 37.788273 | -122.404360 | 0.0 | ASSAULT | 1 |
| 2 | 37.774330 | -122.410802 | 14.0 | ASSAULT | 1 |
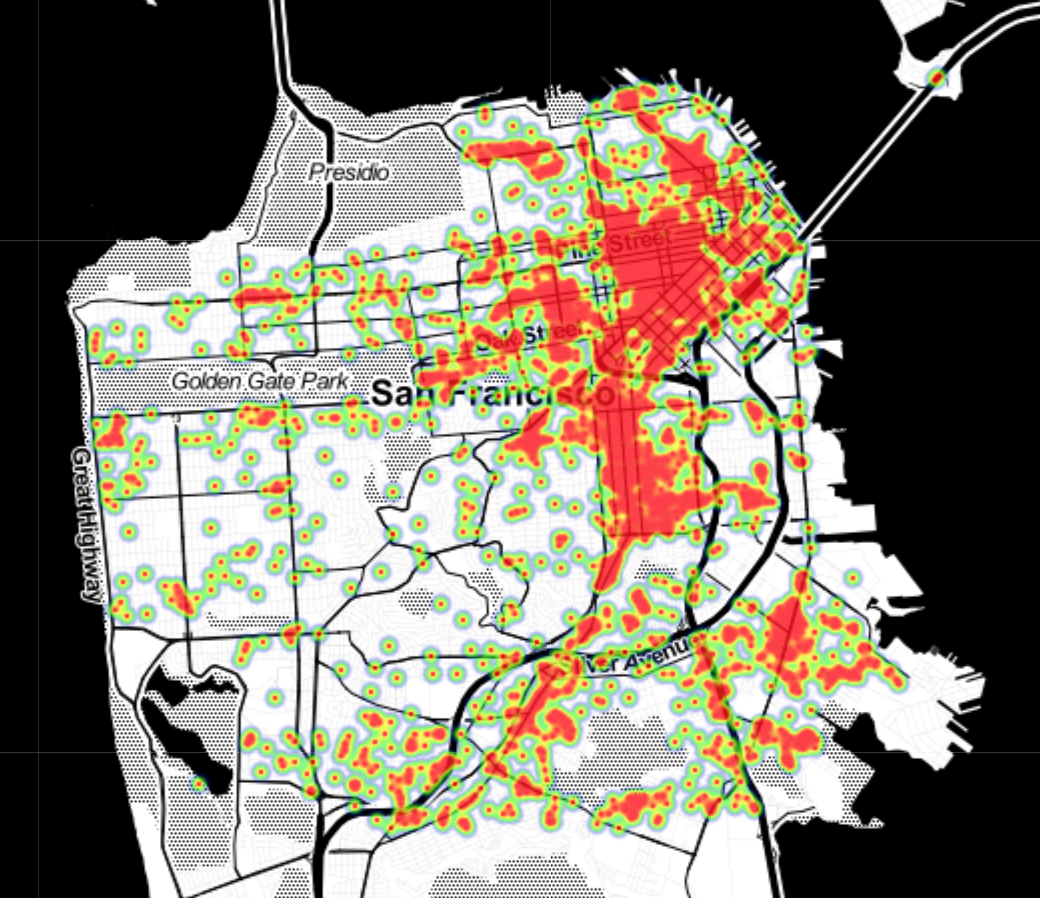
Then we just make the map! We're using Folium, which is an excellent mapping package.
df=df.dropna()
crimes = df['count']
map_data = crimes
m = folium.Map(location=[df.latitude[0],df.longitude[0]+.1], zoom_start=11,tiles='stamentoner')
weights=crimes
heat_df = df[['latitude','longitude']].copy()
heat_df['weight']= weights
#trying to add a heatmap
heat_df['weight'] = heat_df['weight'].astype(float)
heat_df = heat_df.dropna(axis=0, subset=['latitude', 'longitude', 'weight'])
heats=heat_df.as_matrix()
hm = plugins.HeatMap(heats, radius = 4)
m.add_child(hm)
#m.add_child(mc)
m.save(outfile='crime_map.html')
/anaconda3/envs/linkedin_challenge/lib/python3.7/site-packages/ipykernel_launcher.py:4: FutureWarning: Method .as_matrix will be removed in a future version. Use .values instead.
  after removing the cwd from sys.path.
# working heatmap with time
df=pd.read_sql_query('''
SELECT longitude as latitude,
       latitude as longitude,
       extract('hour' from dates::timestamp) as hour,
       category,
       COUNT(*) as num_crimes
FROM sf_crime
WHERE category = 'ASSAULT'
GROUP BY 1,2,3,4
''',engine)
df=df.dropna()
m = folium.Map([df.latitude[0],df.longitude[0]+.1], zoom_start=11,tiles='stamentoner')
heat_data = [[[row['latitude'], row['longitude'], row['num_crimes']]
              for index, row in df[df['hour'] == i].iterrows()]
             for i in set(df.hour)]
# Plot it on the map
hmt = plugins.HeatMapWithTime(heat_data, auto_play=True, max_opacity=0.8, radius = 6)
m.add_child(hmt)
m.save(outfile='crime_data_in_motion.html')
So, that might have been a little more complicated than I hoped, but I think the result is well worth it.
Check it out here!